
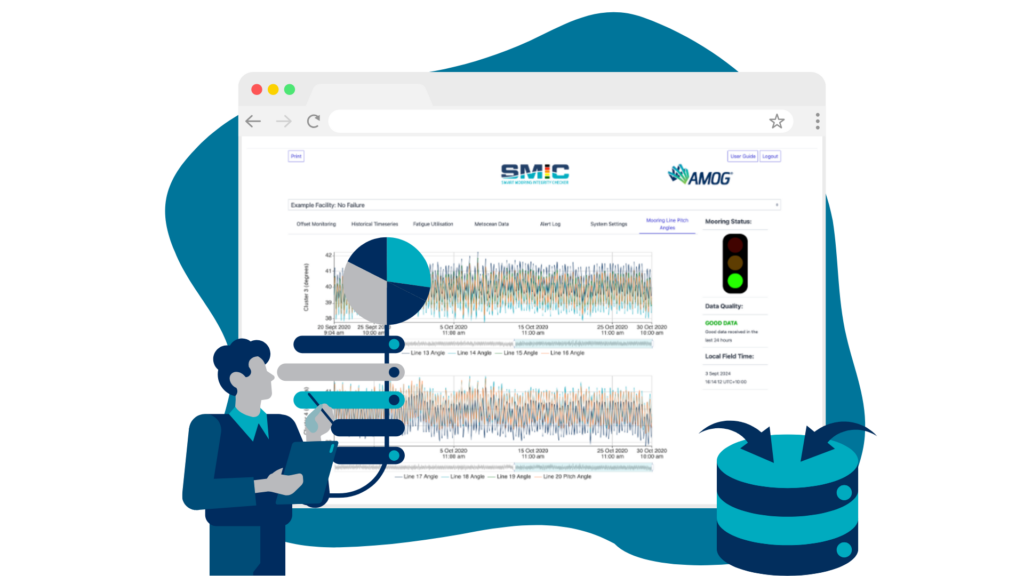


1. Data Collection
Click to learn more
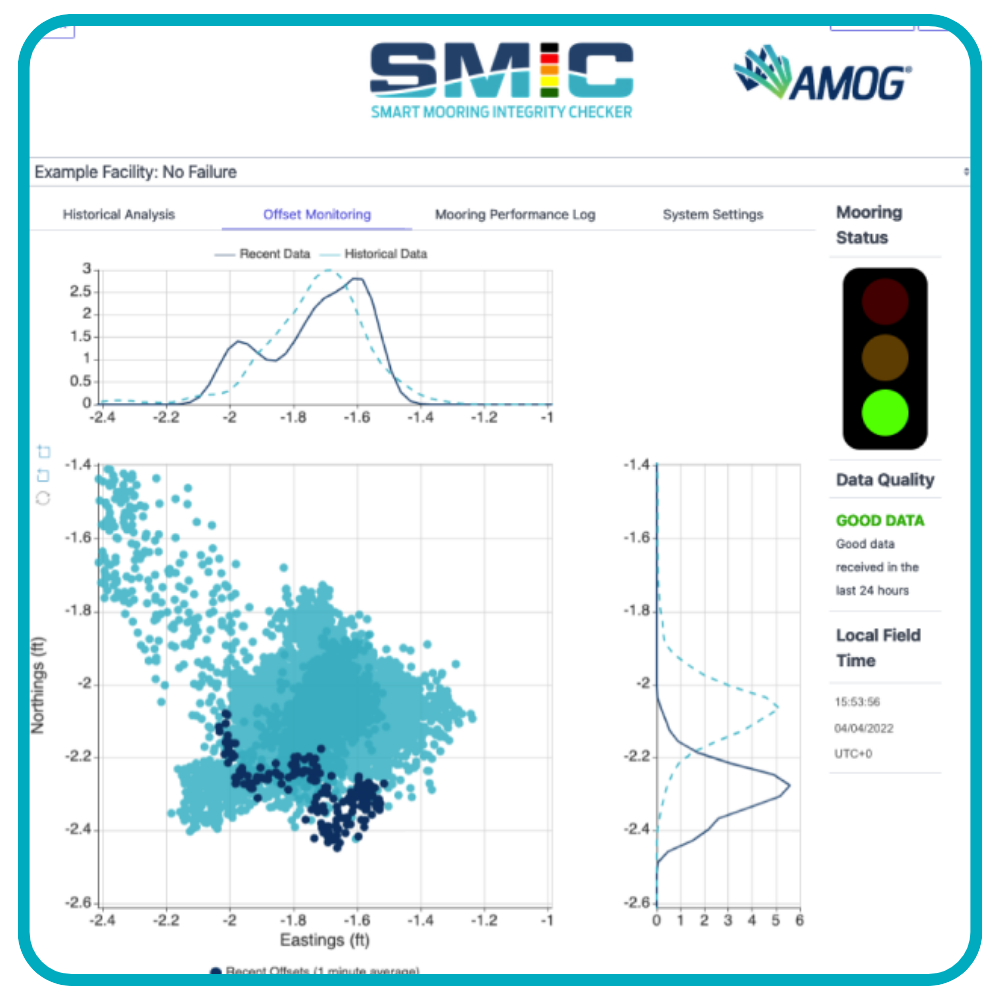
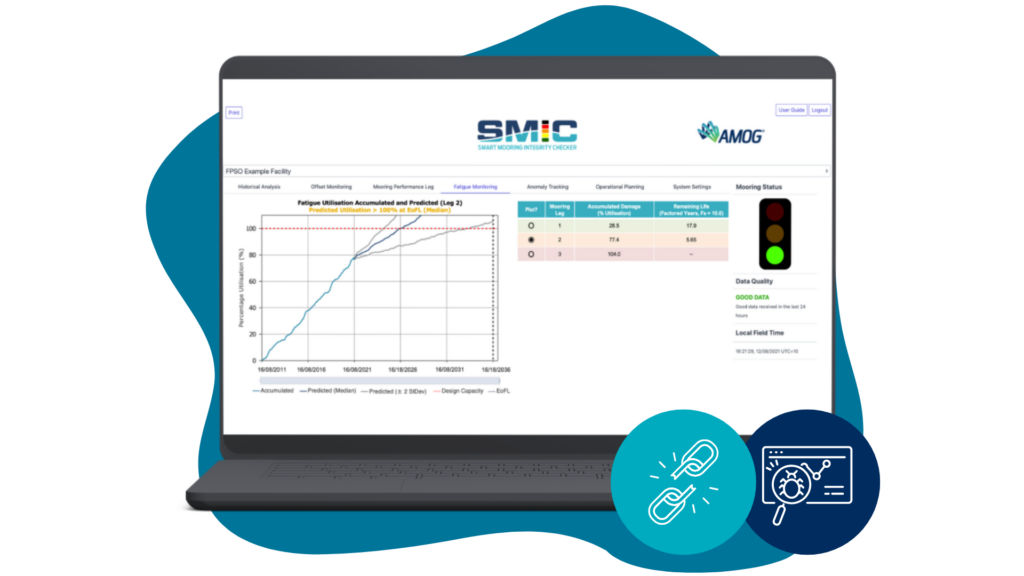
2. Real Time Analysis
Click to learn more

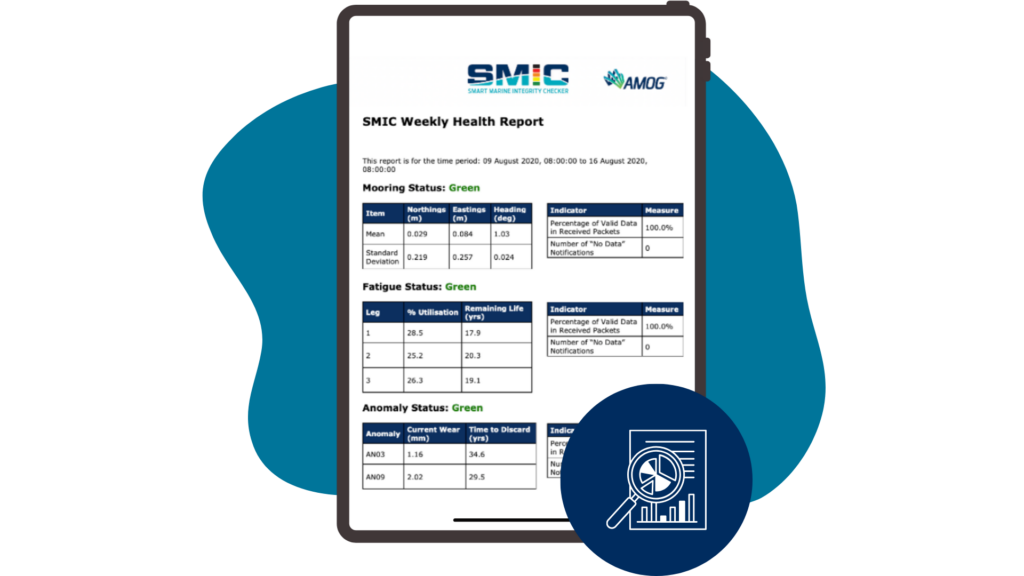
3. Actionable Insights
Click to learn more

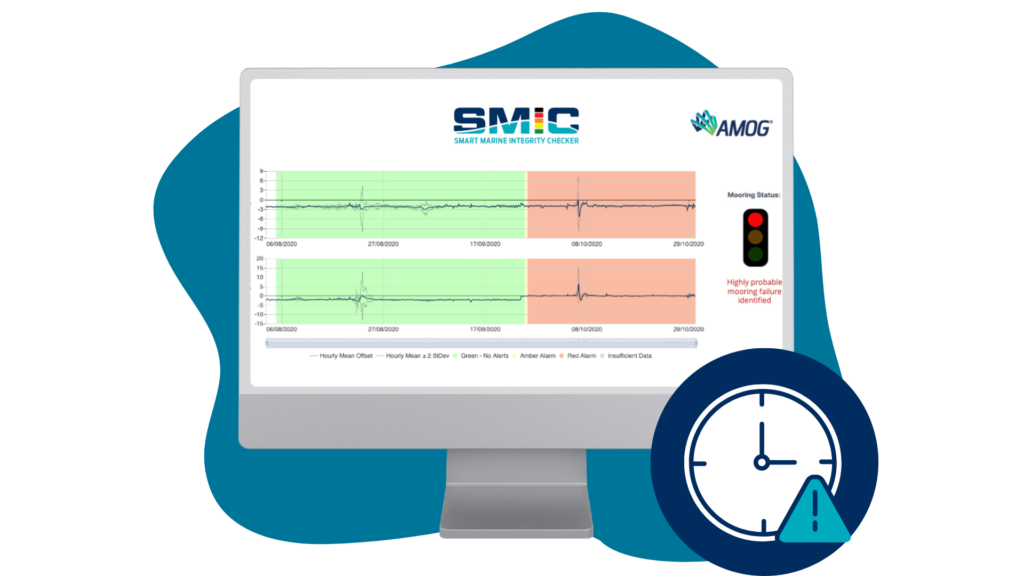
Successfully detected mooring failure using GPS data, confirmed through underwater inspection, allowing for timely intervention

Enabled a 5-year field life extension for a field with marginal fatigue life predictions, with Class approval

Saved an operator millions of dollars in maintenance costs by replacing load cells as the primary means of verification of mooring integrity

